Objective The objective of this project is to design and develop an in-house Business Intelligence (BI) platform using Microsoft Fabric and Power BI to enable centralized, real-time, and standardized reporting across multiple operational systems. The platform aims to: 1. Establish a single source of truth by consolidating data from various hotel systems into a unified reporting framework. 2. Improve data-driven decision-making through real-time analytics and standardized KPIs accessible to all teams. 3. Reduce reliance on external tools and manual reporting processes by automating data ingestion, transformation, and visualization. 4. Integrate essential business datasets (based on prioritized data sources) including operational reports, accounting/P&L data, and performance metrics.
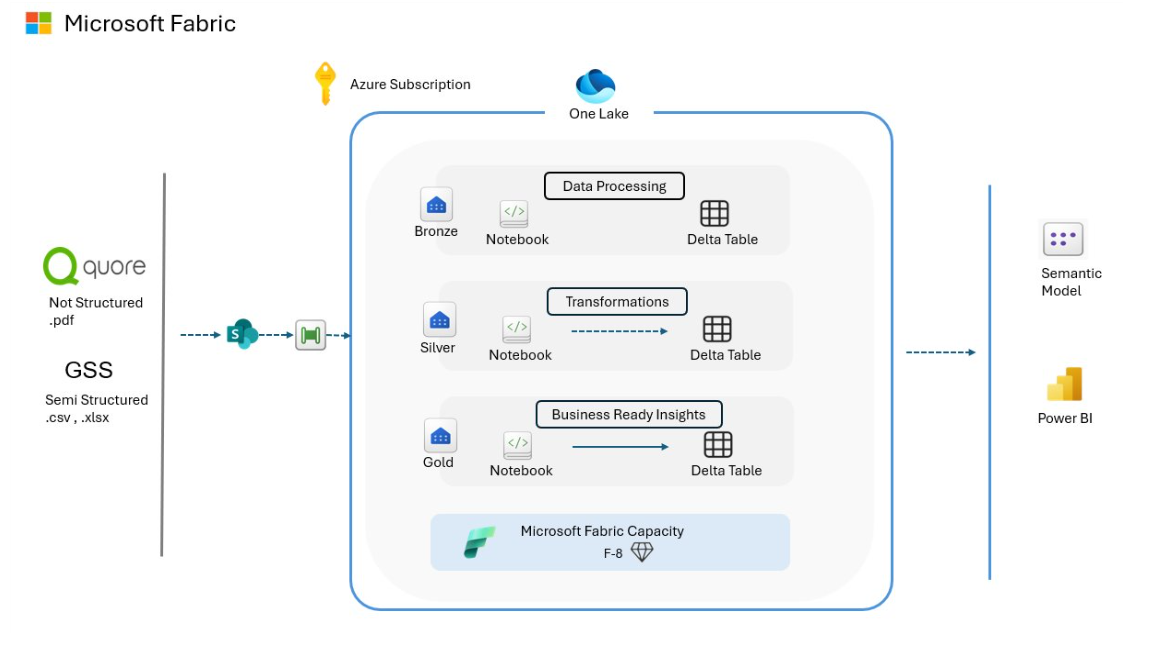
Technology 1. Power Automate – Triggered automation , whenever client sends new email to us, Automated redirection of that document to SharePoint. 2. SharePoint - Acted as the central repository where Client uploaded Excel/PDF reports that were automatically fetched by the system. 3. Fabric Artifact:
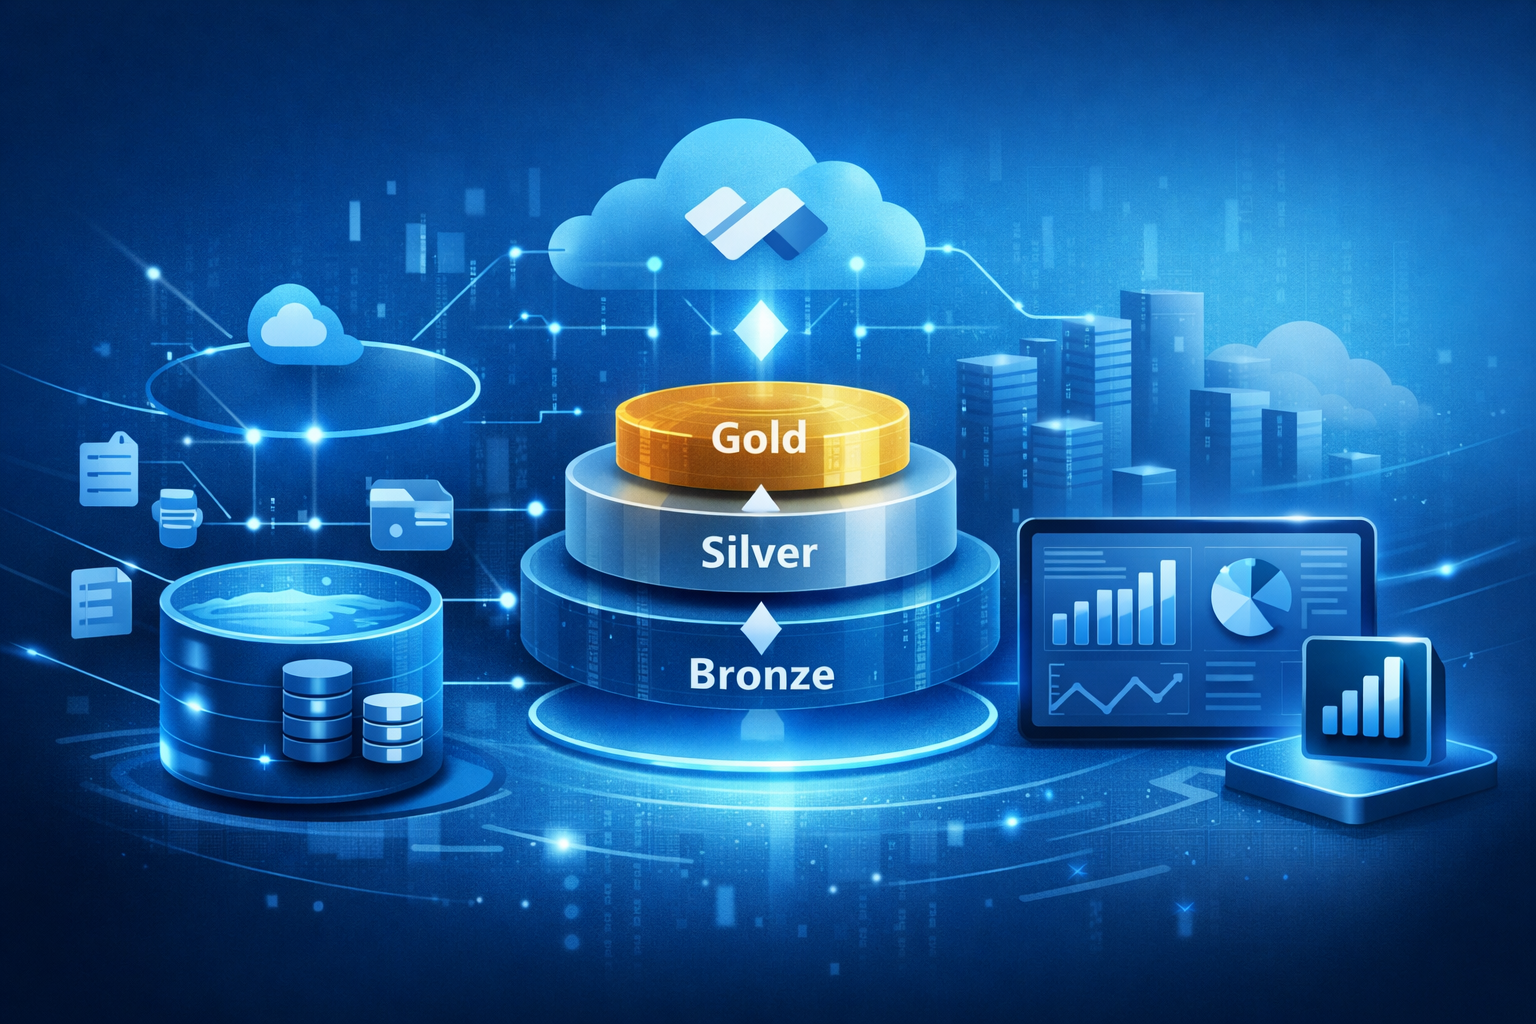
Goals 1. Automate the manual process of collecting and consolidating reports from multiple systems like Quore and GSS. 2. Build an automated pipeline to fetch files from SharePoint and process them without manual intervention. 3. Standardize and clean data coming from different Excel formats into a unified structured model.. 4. Implement Medallion Architecture (Bronze, Silver, Gold) for scalable and organized data processing. 5. Reduce reporting time and eliminate manual errors caused by Excel-based workflows. 6. Create centralized, business-ready datasets to support analytics and decision-making. Solution 1. Designed an automated data pipeline to fetch franchise reports from SharePoint whenever new files were uploaded. 2. Implemented Power Automate Flow to trigger processing workflows and reduce manual intervention. 3. Built Microsoft Fabric Pipelines to orchestrate data ingestion, transformation, and movement across different layers. 4. Created business-ready aggregated datasets in the Gold layer optimized for analytics and reporting. 5. Built interactive Power BI dashboards with filters, KPIs, and performance analytics for stakeholders. 6. Enabled centralized reporting, replacing manual Excel-based workflows with automated insights. Pre-Fabric Architecture Overview
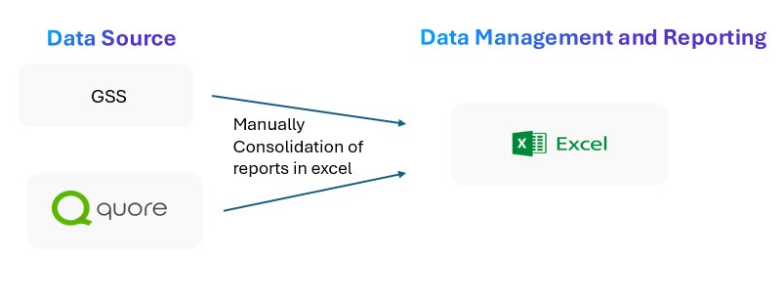
Before Fabric Implementation: 1. Reports were generated from operational systems such as Quore and GSS and downloaded manually as Excel or PDF files. 2. Files were manually uploaded and shared through SharePoint without structured automation or standardized pipelines. 3. Data consolidation, cleaning, and transformation were performed manually in Excel, increasing dependency on human effort and introducing risks of errors. 4. Reporting turnaround time was slow due to manual workflows and lack of automation. 5. No centralized data architecture or structured processing flow to manage ingestion, transformation, and reporting. 6. Limited analytics capabilities — reporting was primarily static rather than interactive or real-time. 7. Difficult to maintain historical tracking, data versioning, and governance. 8. Lack of a unified “single source of truth,” leading to inconsistent reporting across teams. Post-Fabric Architecture Overview
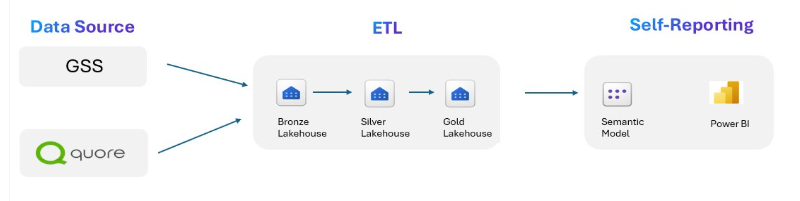
After Fabric Implementation: 1. Implemented a Microsoft Fabric-based data platform with centralized storage, processing, and governance. 2. Automated data ingestion pipelines fetch files directly from SharePoint, eliminating manual uploads. 3. Power Automate flows detect new file uploads or incoming email attachments and automatically trigger processing workflows. 4. Introduced Medallion Architecture (Bronze, Silver, Gold) to manage structured data lifecycle and improve data reliability. 5. Bronze layer stores raw data. 6. Silver layer applies PySpark transformations for data cleaning, normalization, schema standardization, and validation. 7. Gold layer delivers curated, business-ready datasets optimized for reporting and analytics. 8. Delta Tables enable incremental processing, reliable storage, and data versioning. 9. Power BI dashboards provide interactive, real-time analytics and consolidated reporting. 10. Established a centralized “single source of truth” for consistent decision-making across teams. |
TRAVEL & HOSPITALITY
Centralized Reporting for Hospitality - A Microsoft Fabric and Power BI Transformation

Share with your community!
SUCCESS STORIES