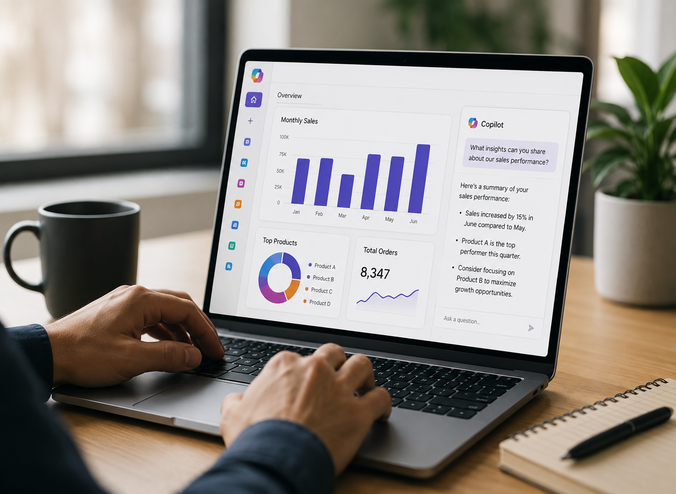
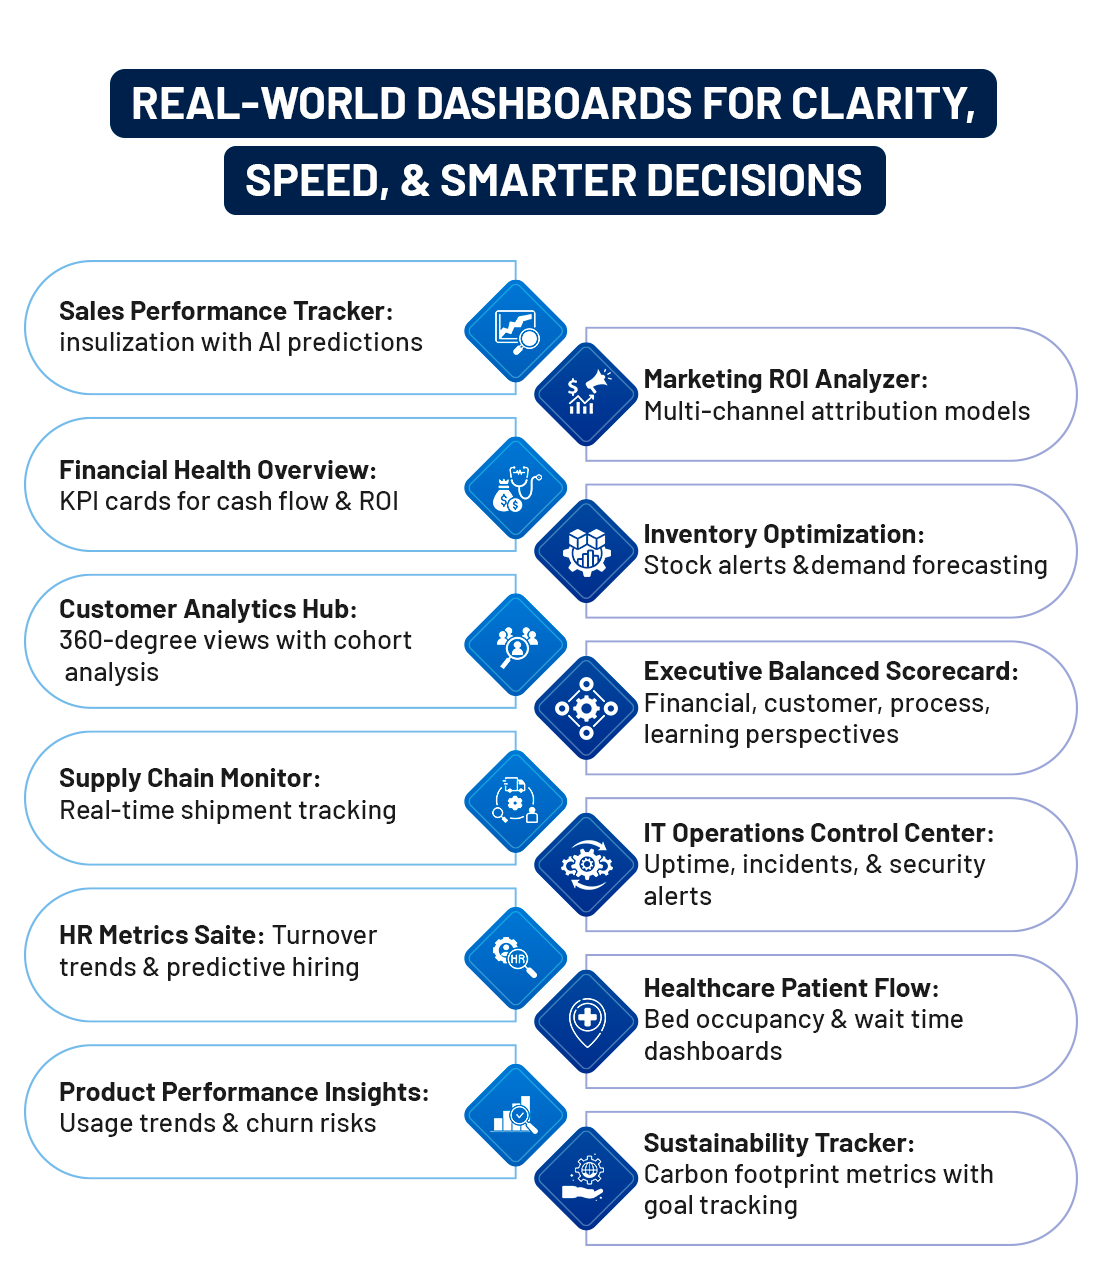
Explore how AI-powered, real-time BI dashboards are reshaping business intelligence in 2026.Smarter visuals.. Faster insights..Predictive intelligence for modern enterprises… In 2026 the enterprise world has to deal with huge amounts of data from hybrid cloud, software as a service (SaaS), and streaming data sources. Traditional reporting methods are too slow and inefficient, so organizations rely on Business Intelligence (BI) dashboards for accurate, real-time reporting and insight generation. As analytics dashboard software market trends 2026 continue to evolve, businesses that adopt modern BI platforms are gaining a measurable competitive edge. 70% of business executives say that they have difficulty taking action on data, however, using real-time analytics helps them to make faster decisions faster; 73% of companies are investing more in data development and analytics skills to help them capitalize on their BI dashboards to gain a competitive edge. Powered by AI and automation, modern dashboards turn fragmented data into predictive, interactive insights. Using reporting and dashboard development services and Power BI report development services, organizations can build scalable, high-performance Business Intelligence dashboard solutions ready for 2026 and beyond. What is a Business Intelligence Dashboard?Business Intelligence Dashboards are digital interfaces providing an interactive display of consolidated data across all related sources through KPIs or business-focused metrics and visualization tools. Unlike traditional static reports, they offer the following advantages: ➤ Updated frequently or in real-time. ➤ Supports drill down capability for detailed analysis. ➤ Provides filtering / slicing features. ➤ Provides AI-based predictive insights. In 2026, majority of dashboards are built on cloud-based solutions, primarily using platforms such as Microsoft Fabric or Microsoft Power BI. They can be effectively scaled across various departments and manage large volumes of transaction, behavioral and sensor data with minimal impact on related operational performance. Core Components of a BI Dashboard➤ Visualizations [Bar charts, line graphs, heatmaps, maps, and gauges] ➤ Filters & Interactivity [Date, region, product, or user-defined slicers] ➤ KPIs [Revenue growth, churn rate, operational throughput, and cost efficiency] ➤ Predictive Elements [AI-driven forecasts based on historical and real-time trends] Understanding the most important features in enterprise BI tools, such as customizable KPIs, advanced analytics, scalable reporting for global IT teams, and department-level data insights, helps organizations prioritize the right capabilities when evaluating platforms. Many organizations work with Dashboard Development Service Providers to create dashboards that mirror current business workflows instead of using templated versions. Reporting and dashboard development services customize these types, blending Power BI's DAX for advanced calculations with Fabric's OneLake for unified data storage. Why Business Intelligence Dashboards Matter in 2026Modern BI dashboards offer organizations: ➤ Instant data-driven decision-making. ➤ Early identification of risks and opportunities. ➤ Enhanced cross-department collaboration. ➤ Performance tracking against strategic objectives. ➤ Reduced dependence on manual reporting. AI-powered dashboards now proactively suggest insights rather than waiting for analysts to discover patterns, giving enterprises a competitive edge. They also serve as best enterprise dashboards for consolidating customer and consumer data, bringing together CRM, ERP, and third-party sources into a single, trusted view. How Business Intelligence Dashboards WorkAt the core of every BI dashboard is a structured data process: ➤ Data Collection Data is gathered from ERP systems, CRM tools, cloud apps, IoT devices, and databases. ➤ Data Integration & Preparation Raw data is cleaned, transformed, and unified into a single data model. For teams asking about external data pipelines for market intelligence dashboards, platforms like Microsoft Fabric with OneLake provide native connectors as the best option in 2026. ➤ Analysis & Metrics Creation KPIs and business rules are applied to measure performance. ➤ Visualization Layer Data is presented through intuitive visuals like bar charts, trend lines, maps, and scorecards. ➤ User Interaction Users filter data, drill down into details, and receive automated alerts when thresholds are crossed. Organizations increasingly depend on dashboard development services to create scalable dashboards that match business objectives and user behavior. Who Needs a Business Intelligence Dashboard in 2026?BI dashboards are no longer limited to large enterprises. They are used by: ➤ Small and mid-sized businesses → tracking sales and cash flow. ➤ Enterprises → Managing ERP, CRM, and cloud platforms. ➤ Executives → Monitoring strategic dashboard KPIs. ➤ Operations teams → Managing supply chains and production. ➤ Marketing and sales teams → Optimizing social media performance dashboards, campaigns, and pipelines, including customer journey analysis. ➤ IT and data teams → Ensuring governance and security. Any organization that relies on data benefits from professional reporting and dashboard development services to build role-based dashboards. This shift drives demand for Power BI report development services to modernize reporting. Evolution of Business Intelligence Dashboards into 2026From simple scorecards in the 1990s, dashboards have evolved into sophisticated AI-powered decision platforms. Tracking business intelligence tools market trends 2026 shows a clear shift toward real-time, AI-native, and cloud-first architectures. By 2026, dashboards integrate: ➤ Generative AI Natural language queries for easy data exploration. ➤ Augmented Analytics Automatic insight suggestions. ➤ Real-Time Streaming Live updates from IoT and transaction streams. Key advancements include mobile-first designs, embedded analytics, collaborative features, and cloud-native scalability. Organizations adopting advanced dashboards see 28% faster decision-making and 10–20% revenue growth. Top Business Intelligence Dashboards Examples for InspirationFrom performance tracking to predictive analytics, these dashboards show what modern BI can truly achieve.
These examples highlight dashboard development services from providers like Dream IT Consulting Services, where Power BI report development services enable drag-and-drop creation with enterprise-grade security. Key Benefits of Business Intelligence DashboardsImplementing Business Intelligence dashboards delivers measurable value: ➤ Faster insights: No waiting for monthly reports. ➤ Improved accuracy: Automated data processing. ➤ Greater transparency: Shared visibility across teams. ➤ Enhanced productivity: Less manual work. ➤ Better strategic alignment: Everyone tracks the same KPIs. Organizations using professional reporting and dashboard development services gain better-designed dashboards tailored to business needs rather than generic templates. How to Build and Use a Business Intelligence Dashboard in 2026Step-by-Step Guide (Power BI Optimized): ➤ Define Objectives: Align KPIs with business goals. ➤ Gather Data: Connect sources via OneLake or APIs while ensuring governance. ➤ Design Visuals: Storytelling layouts, applying best tools for dashboard design principles, with 5–7 elements per page. ➤ Add Interactivity: Implement slicers, bookmarks, and AI-powered visuals. ➤ Test & Deploy: Mobile optimization, security, and row-level access. ➤ Monitor & Iterate: Refine dashboards based on adoption analytics. Pro Tip: Use professional reporting and dashboard development services for custom DAX measures and AI integration to accelerate deployment. Overcoming Common Challenges!! Implementing structured, scalable, and secure BI strategies to resolve critical data obstacles. Best Practices for Business Intelligence Dashboard DesignTo maximize impact, dashboards should be: ➤ Purpose-driven: Designed for a specific role. ➤ Simple: Avoid clutter and unnecessary visuals. ➤ Actionable: Highlight what needs attention. ➤ Consistent: Use standard KPIs and definitions. ➤ Responsive: Work across devices. User experience matters as much as the data itself. Role of Power BI in Dashboard DevelopmentPower BI remains one of the most powerful platforms for dashboard creation in 2026 due to its: ➤ Seamless Microsoft ecosystem integration ➤ AI-powered insights. ➤ Real-time streaming datasets. ➤ Custom visualizations. ➤ Strong security and governance. Many organizations now outsource Power BI report development services to build enterprise-grade dashboards that align with business objectives and compliance needs. When evaluating key factors to consider when choosing BI software, Power BI consistently ranks highly across scalability, cost, and ecosystem integration. Power BI → A Leader in Analytics (BI) and Business IntelligencePower BI has been positioned as a Leader in the 2025 Gartner Magic Quadrant for Analytics and Business Intelligence Platforms, scoring higher on both the Ability to Execute and Completeness of Vision. This Gartner recognition is a testament to Power BI's evolution into a modern BI and analytics Powerhouse ready for the enterprise. This leadership position highlights Power BI's strengths across critical business intelligence capabilities, including: ✓ Enterprise data volume Scalability ✓ AI-driven and predictive analytics ✓ Cloud-native and real-time performance ✓ Enterprise-grade security and governance ✓ Ease of use with advanced modeling For organizations investing in modern BI dashboards, this ranking validates Power BI as a trusted, future-ready analytics platform for real-time reporting, predictive insights, and decision automation. Choosing the Right Dashboard Development ServicesWhen selecting a BI partner, look for: ➤ Industry experience. ➤ Data modeling expertise. ➤ Strong UX design skills. ➤ Automation and AI capabilities. ➤ Ongoing support. A realistic budget for modern BI solutions varies by organization size and complexity, professional dashboard development services ensure scalability, performance, and security while reducing internal workload and delivering measurable ROI. Future of BI Dashboards Beyond 2026➤ Natural language queries. ➤ Embedded AI recommendations. ➤ Hyper-personalized dashboards. ➤ Voice-based analytics. ➤ Automated decision workflows. Dashboards will transition from passive reporting tools to active decision-guiding platforms. Why Choose Professional Services?In 2026, DIY dashboards often fall short in handling complex data, real-time analytics, and enterprise security. Professional dashboard development services and Power BI report development services from Dream IT Consulting Services deliver scalable, high-performance BI solutions tailored to business goals, improving data accuracy, usability, and ROI while letting teams focus on strategy. BI dashboards are essential for clarity, agility, and long-term advantage. From executive reporting to predictive analytics, they unify data and enable smarter, faster decisions across all levels. Investing in modern BI platforms and expert reporting and dashboard development services transforms static reports into intelligent, real-time decision ecosystems. A well-designed BI dashboard is no longer just a reporting tool, it is the command center of modern business. BI Dashboards Explained -> -> What Businesses Ask Most1. How can a BI dashboard improve business performance?BI dashboards provide real-time visibility into key performance indicators (KPIs), helping organizations make faster, data-driven decisions. They enable teams to identify trends, opportunities, and risks early, improving operational efficiency and business outcomes. 2. Should I choose a custom BI dashboard or a template?Templates are suitable for basic reporting requirements, but custom BI dashboards are tailored to your unique business goals, data sources, and KPIs. Custom solutions offer greater flexibility, scalability, and advanced analytics capabilities as your organization grows. 3. Can BI dashboards integrate with our existing business systems?Yes. BI dashboards can connect with a wide range of business applications, including CRM platforms, ERP systems, cloud databases, Microsoft Azure, Microsoft Fabric, marketing platforms, and other enterprise data sources. 4. What are the top BI dashboard trends in 2026?In 2026, organizations are increasingly adopting AI-powered analytics, real-time dashboards, self-service business intelligence, predictive analytics, embedded analytics, and unified data platforms such as Microsoft Fabric. These trends help businesses accelerate decision-making and gain deeper insights from their data. 5. What are the best business intelligence tools in 2026?Leading business intelligence tools in 2026 include Microsoft Power BI, Tableau, Qlik Sense, Looker, and SAP Analytics Cloud. Organizations often choose Power BI for its advanced visualization capabilities, Microsoft ecosystem integration, scalability, and cost-effectiveness. 6. Why is Power BI considered one of the best business intelligence tools in 2026?Power BI continues to be a leading business intelligence platform due to its intuitive dashboards, AI-powered analytics, enterprise security, and seamless integration with Microsoft Fabric, Azure, and other business applications. It enables organizations to transform data into actionable insights at scale. 7. What should businesses look for in a BI dashboard development partner?Businesses should evaluate industry expertise, data integration capabilities, analytics experience, and platform knowledge. Working with a Microsoft Solutions Partner can help ensure access to proven practices and modern Microsoft technologies. |
Business Intelligence Dashboard in 2026: Complete Guide, Examples & Benefits

Share with your community!
BLOGS